IPython console
A fully functional IPython console (Jupyter 5.4.0) is available in the “IPython” tab of the central area (see IPython documentation).
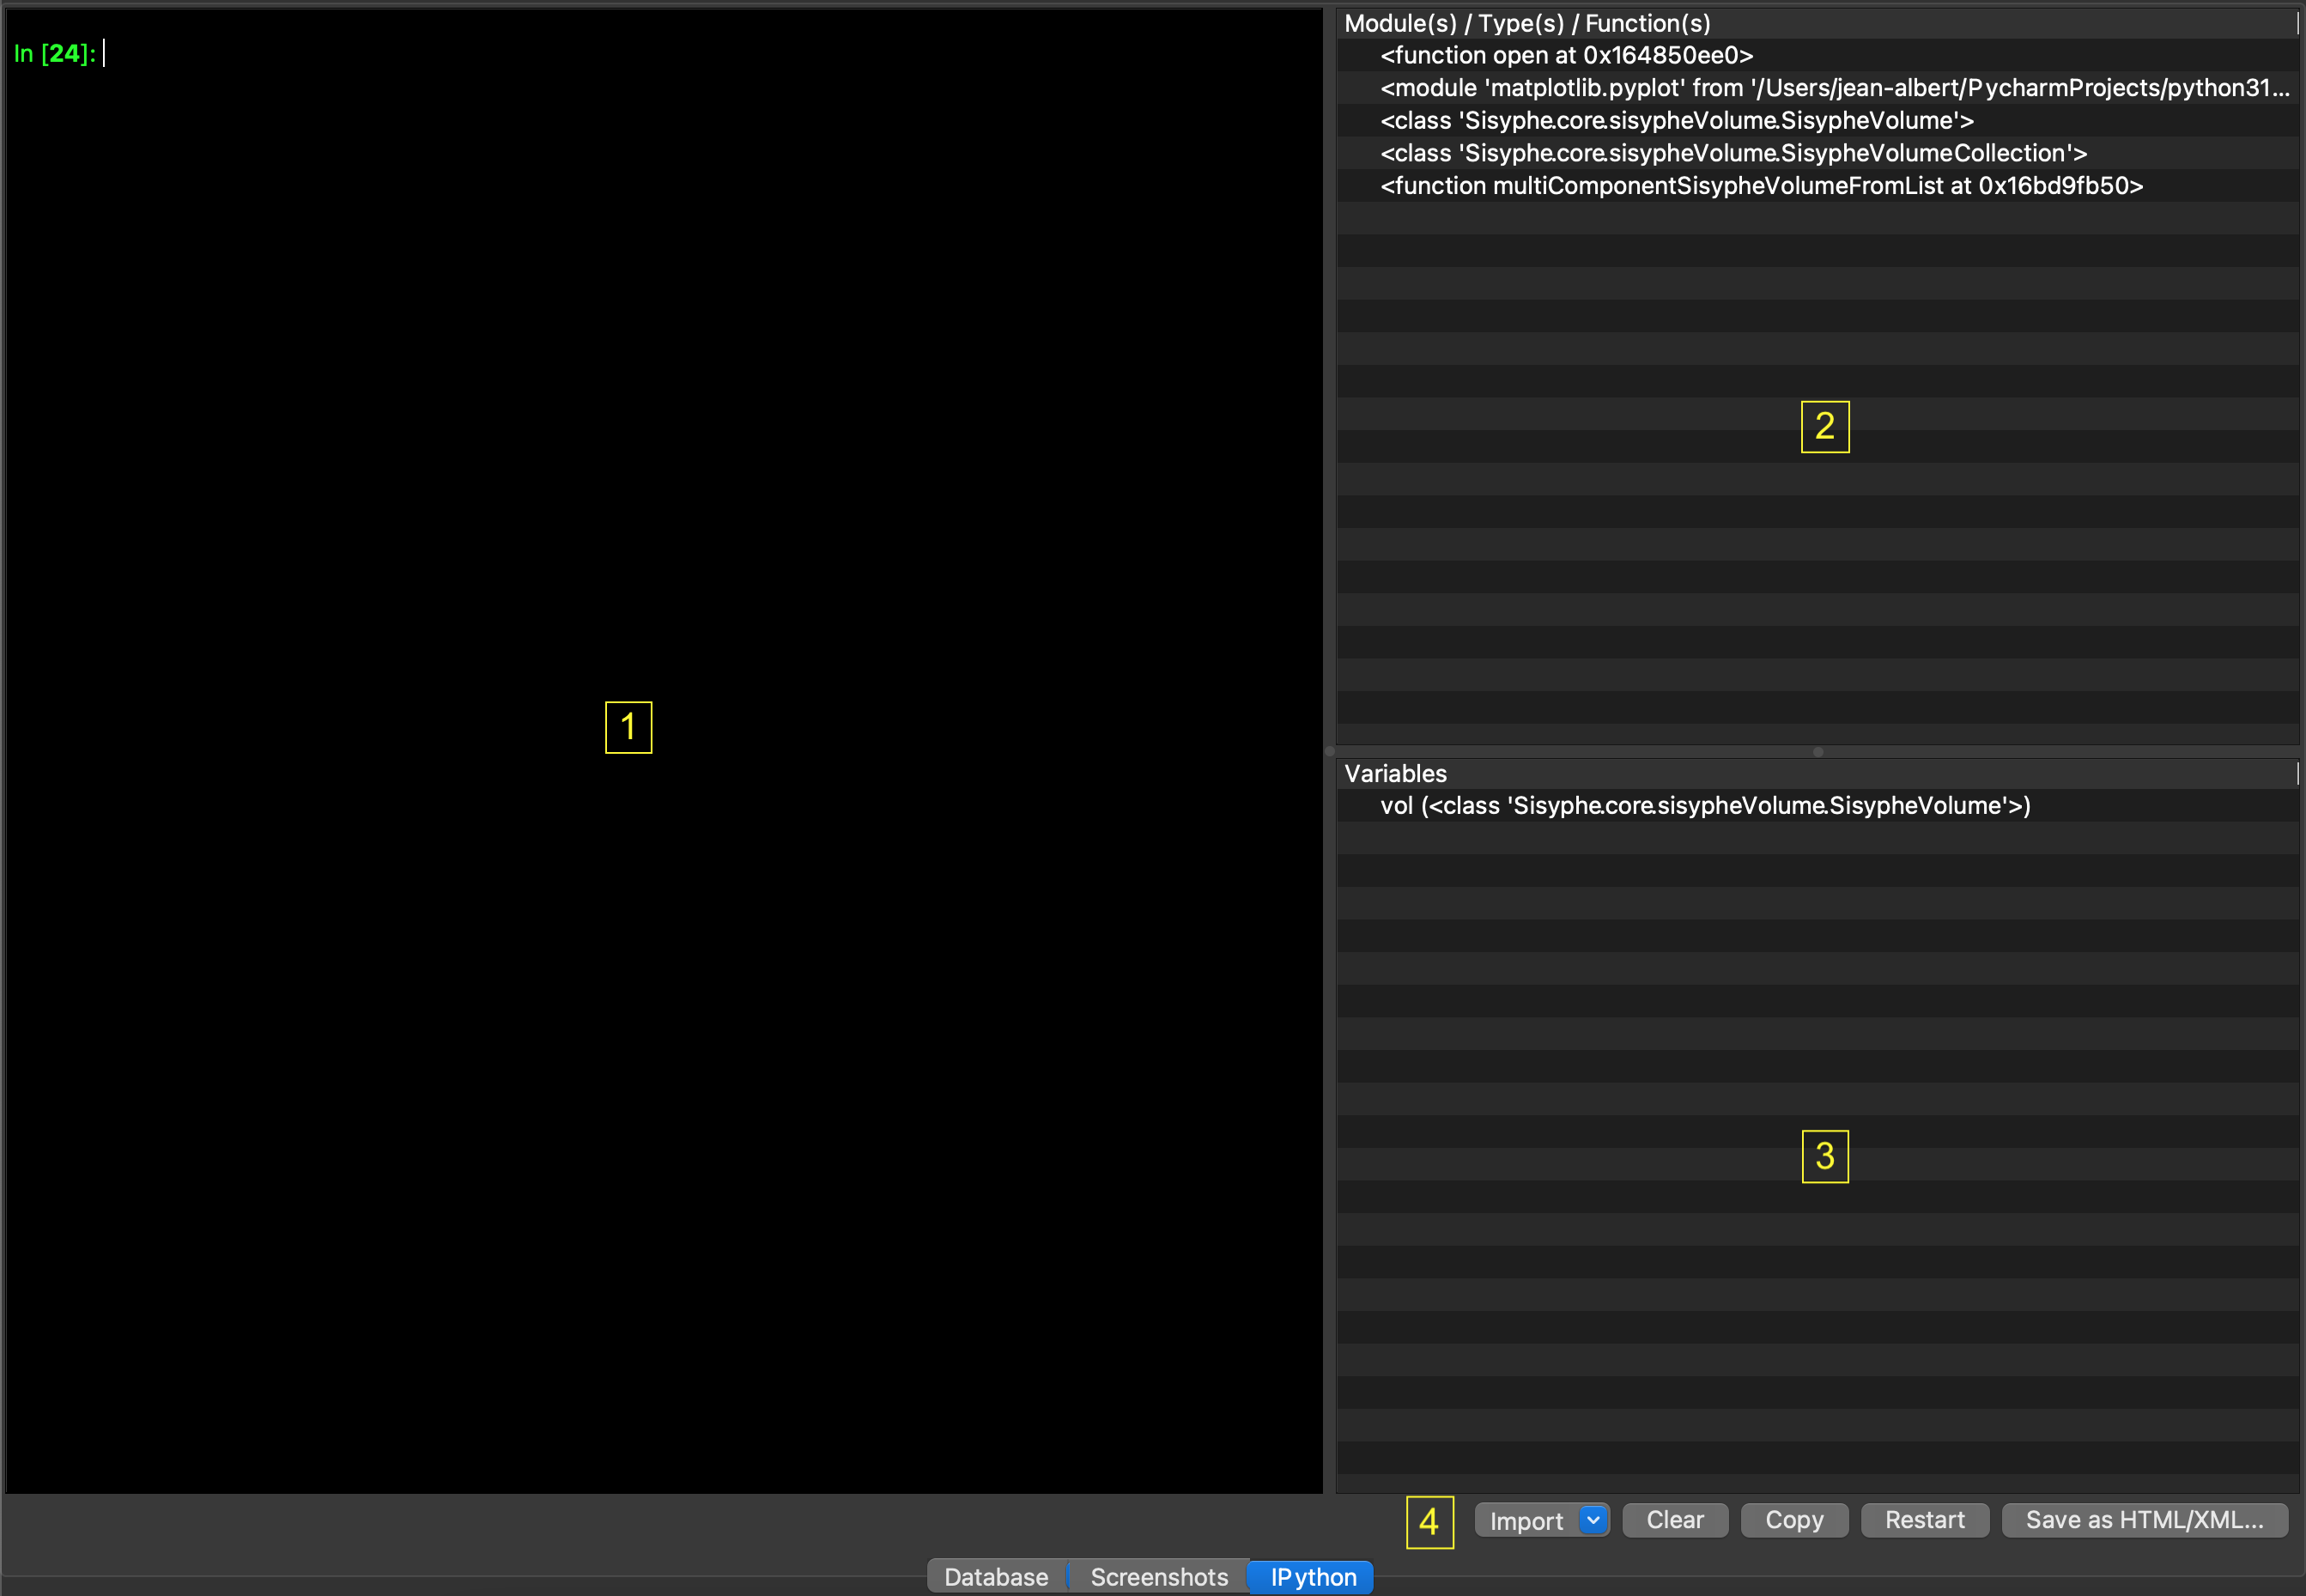
Command line on the left (1). Right-click displays a popup menu:
Cut, cut selected text.
Copy, copy selected text to the system clipboard.
Paste, paste clipboard text to the console.
Select all, select all of the console text.
Save as HTML/XML, save the console display to HTML/XML file.
Print, open a print dialog to print the console display.
Right-click a chart image displays another popup menu:
Copy Image, copy the chart image to the system clipboard.
Save Image As, save the chart image in png bitmap format.
Modules/Types/Functions imported into the environment are displayed in the list box at top-right (2). A tooltip pops when mouse cursor remains in front of a box element. It displays its docstring.
Variables are displayed in the list box at bottom-right (3). A tooltip pops when mouse cursor remains in front of a variable. It displays its value converted to string.
Double-click on a SisypheVolume, sitkImage (see SimpleITK Image class), ANTsImage (see ANTs Image class), vtkImageData (see VTK Image class) or ndarray variable (see Numpy ndarray class) opens it in the thumbnail bar.
Right-click on 1D/2D ndarray, 2D sitkImage, or Pillow Image displays a popup menu that allows you to select various Matplotlib charts to draw at the current console prompt. A dialog box opens to select the display settings for each chart. Matplotlib Figure and Axes variables of the current chart are created under the names ‘fig’ and ‘ax’.
The available charts are listed below:
Line plot, 1D ndarray or 2D (one line plot for each row vector)
Bar plot, 1D ndarray or 2D (one bar plot for each row vector)
Stairs plot, 1D ndarray or 2D (one stair plot for each row vector)
Box-and-Whisker plot, 1D ndarray or 2D (one Box-and-Whisker plot for each row vector)
Violin plot, 1D ndarray or 2D (one violin plot for each row vector)
Histogram plot, 1D ndarray or 2D (one histogram for each row vector)
Scatter plot, 2D ndarray with 2 rows (1 row vector for x, 1 row vector for y) or 2 columns (1 column vector for x, 1 column vector for y)
Matrix plot, 2D ndarray
Image plot, 2D ndarray, SimpleITK Image or Pillow Image variable
Five buttons (4):
Import, import of most-used modules (PySisyphe core modules, ANTs, Matplotlib, NiBabel, Nilearn, Numpy, Pandas, Pillow, PyDicom, Scikit-image, SciPy, SimpleITK)
Clear, clear console.
Restart, restart console.
Save HTML/XML, save the console display to HTML/XML file.
Same functions (1, 2, 3 and 4) are accessible via the menu bar (Views -> IPython)..
Most popular commands
Up/Down keys to get command history.
Tab key (->|) to display a popup menu with autocomplete suggestions for available modules/classes/methods/functions related to the string preceding the current cursor position on the prompt line.
This popup menu with autocomplete suggestions also appears automatically after typing a dot.
CTRL-RETURN to enter more than one statements in a single input (multi-line editing), press CTRL-RETURN after the first line. Subsequently, just pressing RETURN will go on adding new line. To stop entering new lines and running, press RETURN key one more time at the end.
- ?
IPython help.
- <object>?
Returns <object> docstring
- %cd
Change the current working directory.
%cd <dir> changes to directory <dir>
%cd .. changes to previous directory
%cd - changes to last visited directory.
- %colors <scheme>
Switch color scheme for prompts, info system and exception handlers. Currently implemented schemes: nocolor, linux, lightbg.
%config
%config <class>[.<field>=<value>]
%config with no argument to see what <classes> are available.
%config <class>, to view <fields> for a given class.
%config <class>.<field> = <value>, setting <value> to <field>.<class>.
- %env <var> [<value>]
Get, set, or list environment variables.
%env with no argument, lists all environment variables/values.
%env <var> get value for environment variable <var>.
%env <var> <value> set <value> for <var>.
- %gemini
Send a request to the Gemini AI model. Images or pdfs can be analyzed. The result is stored in the ‘r’ variable.
args:
-p prompt, str
-i image input to analyze, PIL.Image
-pdf input to analyze, str or pathlib.Path
-json, result in json format
-model, print current ai model
-key, print current api key
- %ls
List directory contents.
- %open
Open various file types. The file is opened in a variable “v” whose type relies on the file extension.
args: ? or help to show supported file extensions.
Supported files:
Volume files:
.xvol: PySisyphe volume, SisypheVolume instance
.nii, .hdr, .img, .nia, .nii.gz, .img.gz: Nifti volume, SisypheVolume instance
.nrrd, .nhdr: Nrrd volume, SisypheVolume instance
.mnc, .minc: Minc volume, SisypheVolume instance
.mgh, mgz: FreeSurfer volume, SisypheVolume instance
.vmr: BrainVoyager volume, SisypheVolume instance
.vol: Sisyphe volume, SisypheVolume instance
.vtk, .vti: VTK volume, SisypheVolume instance
.dcm, .dicom, .ima, .nema: DICOM image, PyDicom Dataset instance
Volume attributes files
.xacpc: PySisyphe AC-PC attributes, SisypheACPC instance
.xacq: PySisyphe acquisition attributes, SisypheAcquisition instance
.xdcm: PySisyphe XML Dicom, XmlDicom instance
.xdisplay: PySisyphe display attributes, SisypheDisplay instance
.xfid: PySisyphe stereotactic frame markers, SisypheFiducialBox instance
.xidentity: PySisyphe identity attributes, SisypheIdentity instance
ROI files
.xroi: PySisyphe ROI, SisypheROI instance
.roi: Sisyphe ROI, SisypheROI instance
LUT files
.xlut: PySisyphe LUT, SisypheLut instance
.lut: Sisyphe/MRIcron LUT, SisypheLut instance
.olt: BrainVoyager LUT, SisypheLut instance
Geometric transformation files
.xtrf: PySisyphe geometric transformation, SisypheTransform instance
.xtrfs: collection of PySisyphe geometric transformations, SisypheTransformCollection instance
.xfm: XFM geometric transformation, SisypheTransform instance
.tfm: TFM geometric transformation, SisypheTransform instance
.trf: BrainVoyager geometric transformation, SisypheTransform instance
.mat: ANTs geometric transformation, SisypheTransform instance
Mesh files
.xmesh: PySisyphe Mesh, SisypheMesh instance
.obj: OBJ wavefront Mesh, SisypheMesh instance
.stl: STL 3D Systems Mesh, SisypheMesh instance
.vtp: VTK Mesh, SisypheMesh instance
Tools files
.xtools: collection of PySisyphe tools, ToolWidgetCollection instance
.xline: PySisyphe trajectory tool, LineWidget instance
.xpoint: PySisyphe target tool, HandleWidget instance
Tracking files
.xtract: PySisyphe Streamlines, SisypheStreamlines instance
.tck: TCK Streamlines, SisypheStreamlines instance
.trk: TRK Streamlines, SisypheStreamlines instance
.trk: TRK Streamlines, SisypheStreamlines instance
.fib: FIB Streamlines, SisypheStreamlines instance
.dpy: Dipy Streamlines, SisypheStreamlines instance
Data files
.csv: CSV table format, Pandas DataFrame instance
.dta: Stata table format, Pandas DataFrame instance
.npy, .npz: Numpy vector/array format, numpy ndarray instance
.json: JSON format, dict
.sas7bdat: SAS table format, Pandas DataFrame instance
.sav: SPSS table format, Pandas DataFrame instance
.xlsx: Excel table format, Pandas DataFrame instance
.xml: XML format, list[str]
.xsheet: PySisyphe table format, SysipheSheet instance
Document files
.pdf: PDF format, PyMuPDF document instance
.txt: Text format, list[str]
- %pwd
Return the current working directory path.
- %packages
Provide information about the modules installed in the current Python environment.
args:
? or help
no arg or package names separated by spaces
- %run <filename.py>
Run the named file <filename.py> inside IPython as a program.
- %time <python expression>
Time execution of a Python statement or expression.
- %who
Print all interactive variables, with some minimal formatting.
- %whos
Like %who, but gives some extra information about each variable.